Time Series Forecasting for Server CPU Utilization
Developed a predictive model to forecast server CPU utilization on an hourly basis using historical data from January to November 2023. Implemented three different time series models—Moving Average, S-curved Trend Model, and LSTM—to compare forecasting performance. The models were evaluated based on accuracy metrics, and the best-performing model was used to predict CPU utilization trends for December 2023. This analysis helps in proactive resource management and server performance optimization.
Preview:

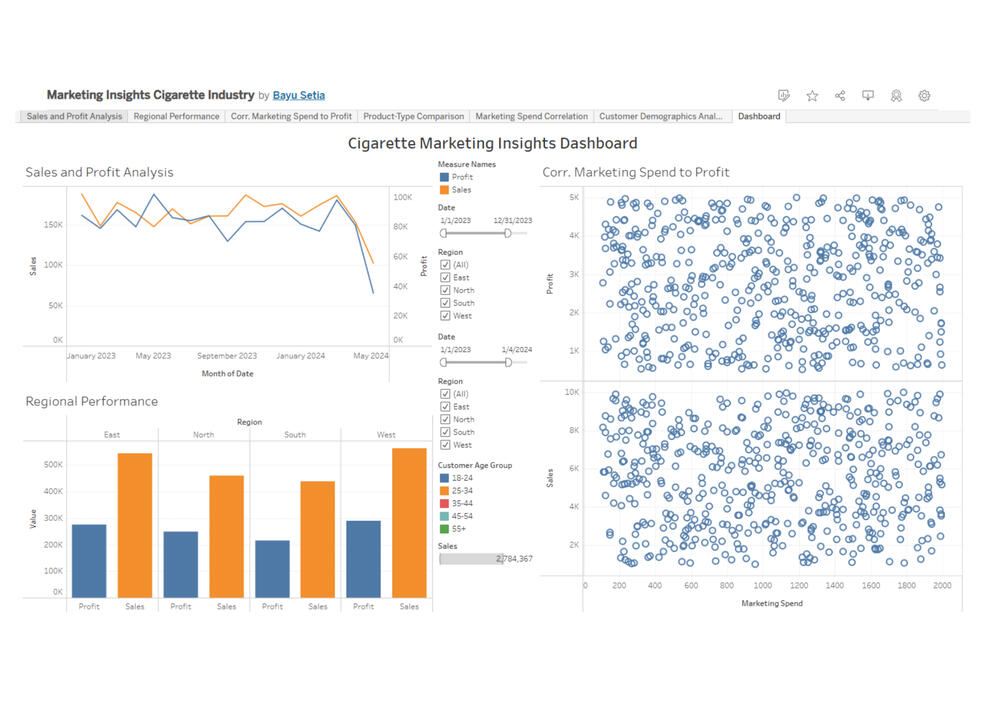
Tableau for Cigarette Marketing Insights Dashboard
In the competitive landscape of the cigarette industry, leveraging data to understand consumer behavior and market trends is vital for effective marketing strategies. This project presents a Tableau dashboard designed to visualize key insights from sales and marketing data, including sales performance, marketing expenditures, and demographic segmentation.
Preview:
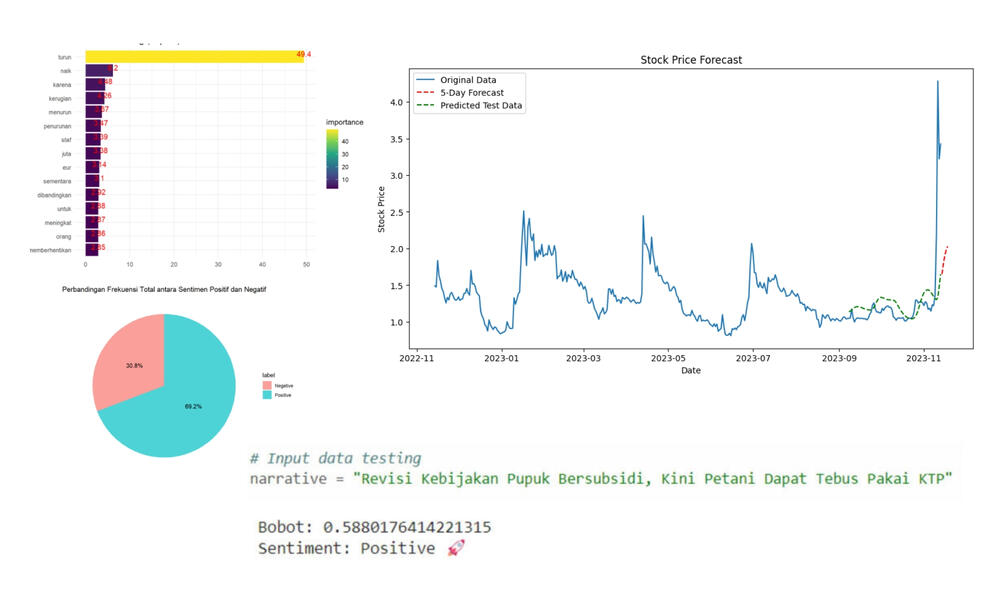
Finance AI
Finance AI is a team project from PukulEnam (a data technology company offering solutions and services to improve data literacy in Indonesia) to develop their online news website by adding a widget to predict the next day's stock prices using sentiment analysis and time series forecasting of historical data from the Yahoo Finance website. Our goal is to give traders and regular folks (readers of the Finance News) an easy tool for quick insights into market vibes and accurate predictions of stock prices at the start of trading.
Preview:
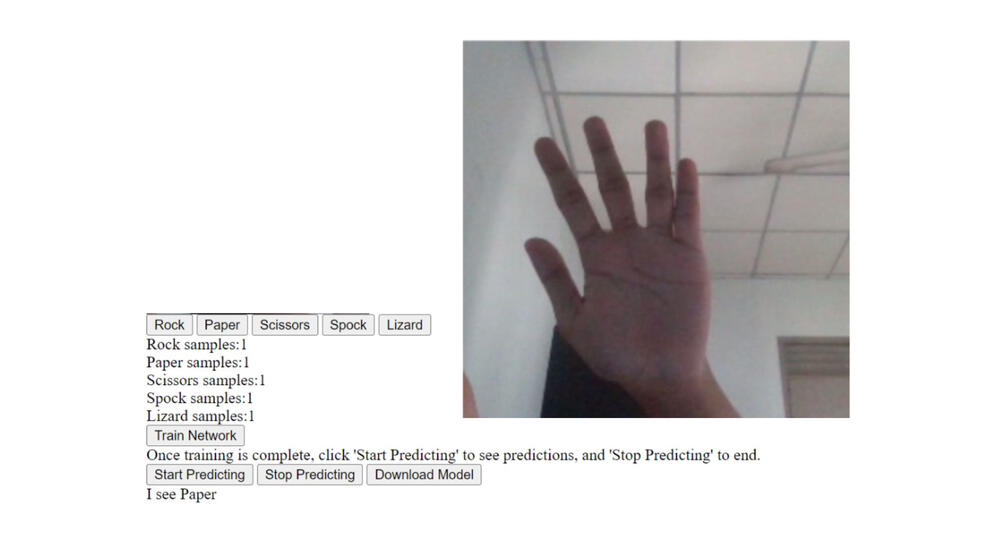
Rock, Paper, Scissors, Lizard, Spock
This project introduces an extension to the traditional Rock, Paper, Scissors game by incorporating additional hand gestures: Lizard and Spock. The objective is to train a machine learning model directly in the browser using a webcam.
Preview:
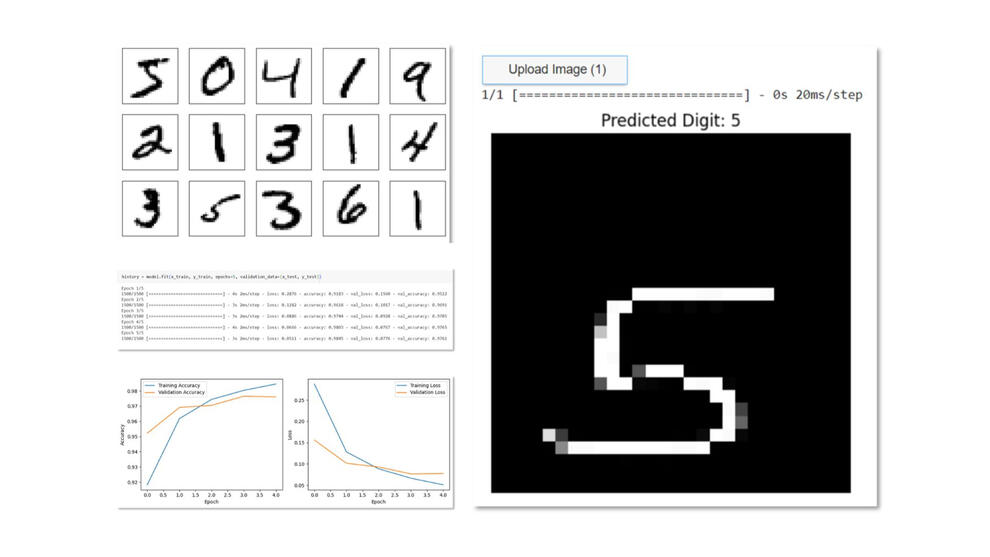
Handwritten Digit Recognition
This project involves the creation and training of a handwritten digit recognition model using TensorFlow/Keras. It includes notebooks for model training, testing, and inference on new images.
Preview:
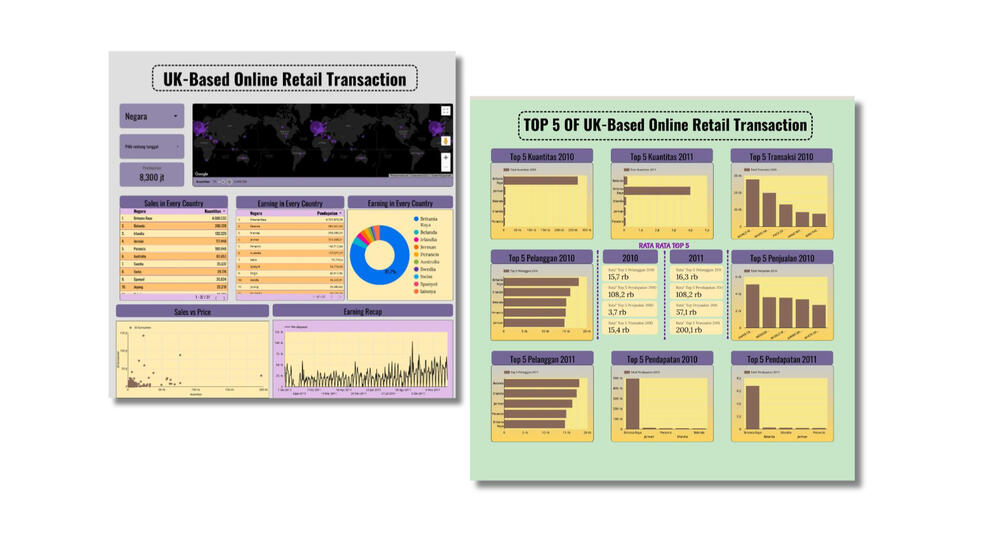
E-Commerce Market Analysis Case with Google Data Studio/Looker Studio
The E-Commerce Market Analysis Case project is a team project that analyzed the market for an e-commerce data set (PT X) by examining two years of sales data to improve market position and identify key trends. Utilized statistical methods for data preprocessing, exploration, and consumer preference analysis. Produced detailed executive summaries and developed an interactive results dashboard using Google Data/Looker Studio (GDS) to present findings.
Preview:
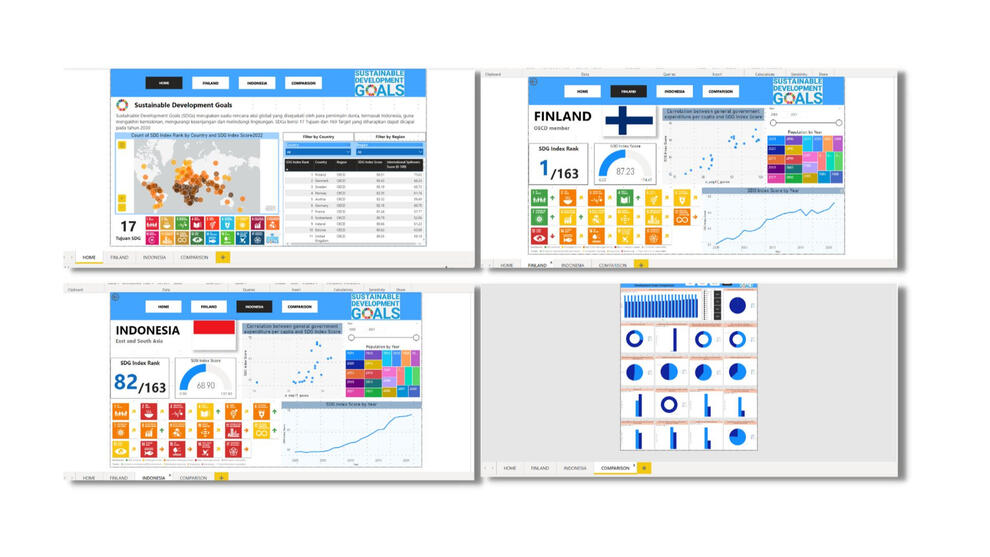
Power BI for SDGs Dashboard
A Power BI dashboard project comparing each category of the Sustainable Development Goals (SDGs) of Finland, which ranks first, with Indonesia to gain insights into what actions can be taken to improve Indonesia's conditions. Developed an interactive Business Intelligence dashboard using Power BI to facilitate the comparison of Indonesia and Finland's progress across 17 Sustainable Development Goals (SDGs). This dashboard provides stakeholders and decision-makers with strategic insights for impactful policy changes. The project involved leveraging data analysis, visualization, statistical techniques, and R programming to create a comprehensive comparative tool.
Preview: